Nishma PM
Data Analyst | MSc Physics + MBA (AI) | Power BI · SQL · Excel · Python
LinkedIn ·
GitHub
🌊 Bangalore Lakes Water Quality Analysis
PythonPandasStreamlitFolium

Analyzed 13 months of Bangalore lake water quality data (BOD & Dissolved Oxygen) from
government PDF reports. Found 7 of 19 major lakes chronically below the healthy oxygen
threshold. Built an animated racing bar chart, an interactive lake map, and a live
Streamlit "what-if" simulator predicting oxygen recovery from pollution reduction.
View Project →
Live Demo →
📊 Sales Performance Dashboard — Power BI
Power BIDAXData Viz

Interactive dashboard analyzing sales by category, region, and delivery
performance. Electronics drives 71% of revenue. North region leads profit.
₹2.2L revenue at risk from undelivered orders.
View Project →
🏏 IPL Match Analysis 2008–2024 — Python
PythonPandasMatplotlibSeaborn
Analyzed 900+ matches and 200,000+ ball-by-ball records. Found chasing
win rate rose from 45% to 55% over 17 seasons. Toss advantage is statistically
overrated — only 50% win rate.
View Project →
🗃️ SQL Business Intelligence Queries
SQLWindow FunctionsCTEs
10 business intelligence queries using window functions, CTEs, and
complex JOINs to answer real business questions from a retail sales database.
View Project →
📈 Sales Data Analysis — Excel
ExcelPivot TablesVLOOKUP
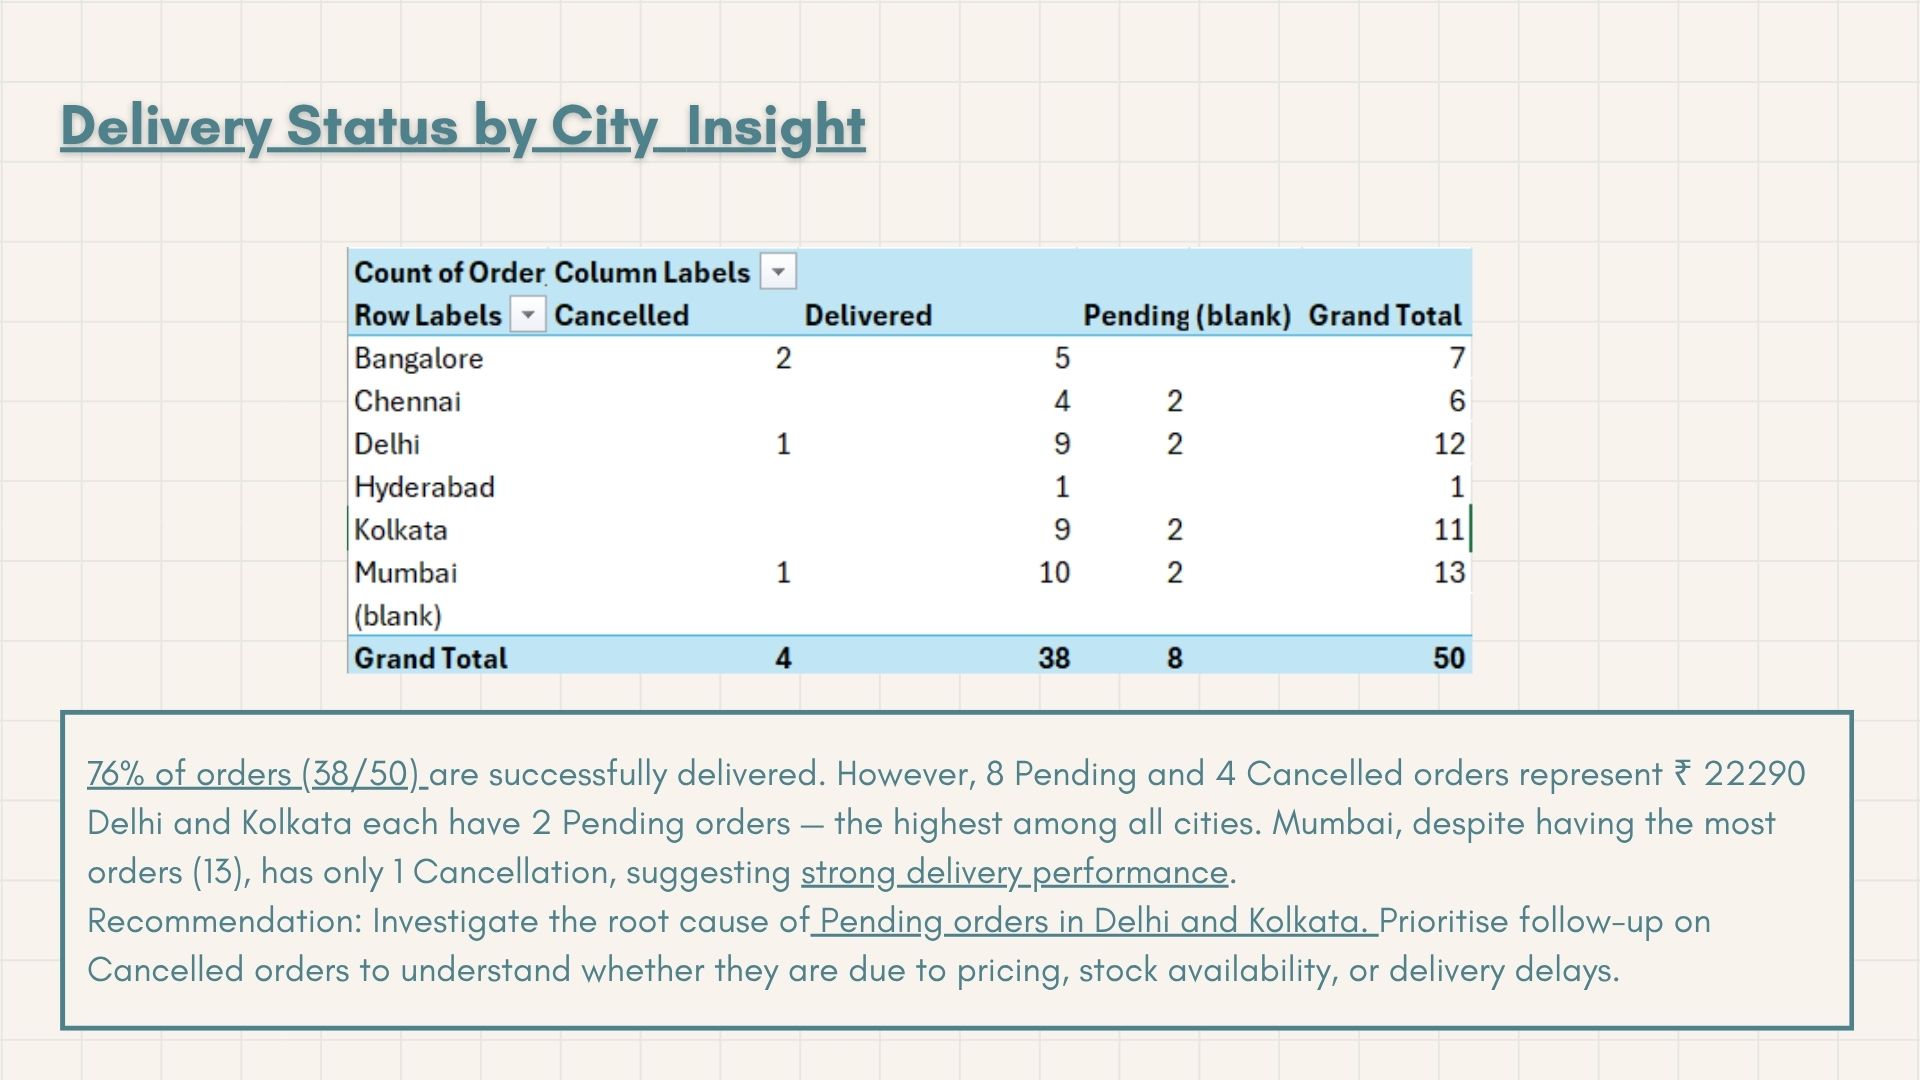
Cleaned and analyzed Indian retail sales data across 6 cities.
Built 4 pivot tables. Identified Delhi and Kolkata delivery failures,
Laptop as highest-profit product at 2.5% discount.
View Project →
👥 Customer Segmentation — RFM Analysis
Excel
RFM Framework
Pivot Tables
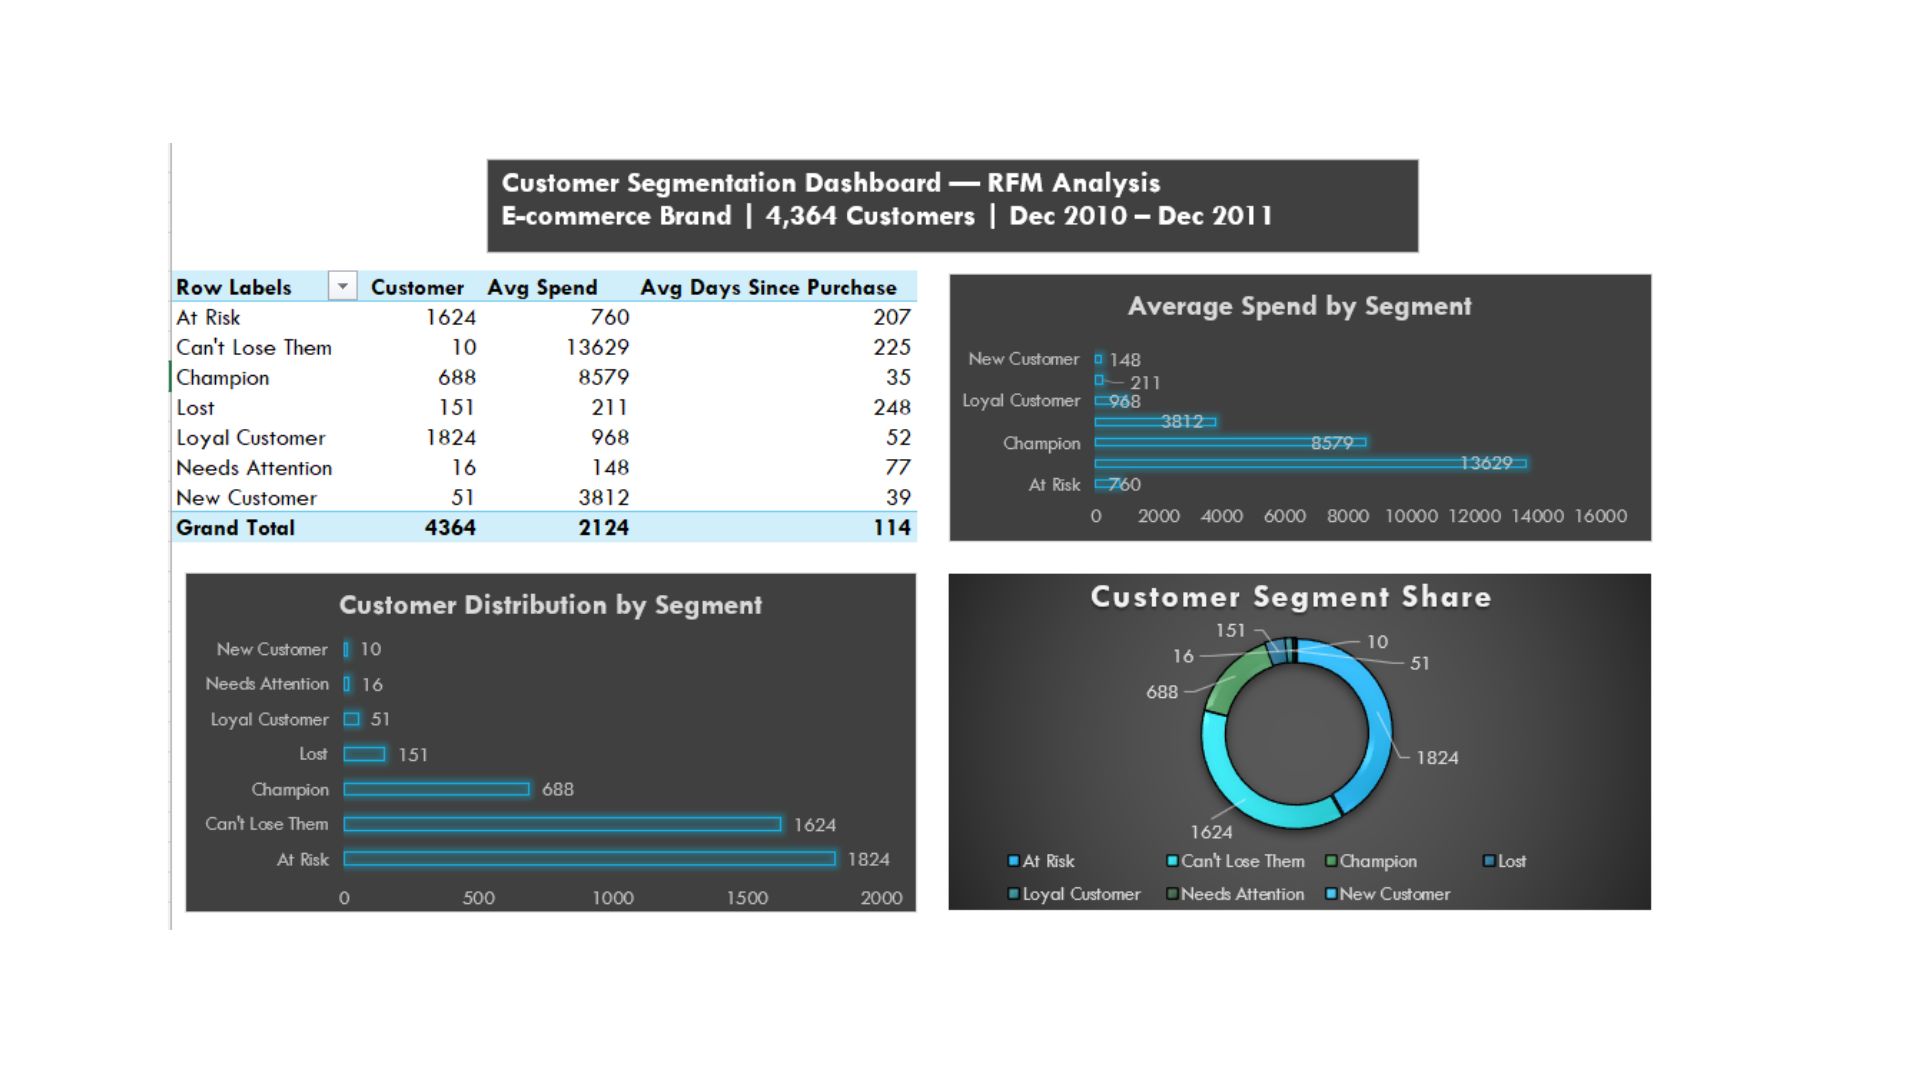
Segmented 4,364 customers of a UK e-commerce brand using RFM scoring. Found 37% of customers are At Risk, and 10 VIP customers averaging £13,629 spend are going silent. Built in Excel with pivot tables and custom RFM scoring.
View Project →